

Finland’s industrial sector has no shortage of data.
Machines generate measurements. Control systems record events. Production lines capture operational history. Connected equipment produces increasingly detailed records.
But the harder question is different:
Can your business actually read and use the industrial data it already owns?
Industrial data analytics Finland is becoming increasingly important as manufacturers look for better operational visibility, more efficient maintenance, and stronger foundations for industrial AI.
The opportunity is not always to install another platform or replace existing equipment.
Sometimes, the first step is simply understanding what is already inside the systems you have.
What Is Industrial Data Analytics?
Industrial data analytics is the process of collecting, interpreting, and analysing data generated by industrial equipment, production systems, sensors, and operational processes.
For manufacturers, this can include:
- Machine measurements
- Alarm and event records
- Production data
- Maintenance history
- Energy consumption
- Quality measurements
- Equipment performance data
The goal is not simply to create more dashboards.
The goal is to turn operational data into evidence that engineers, operators, and business leaders can use to make better decisions.
This distinction matters because many industrial environments contain valuable information that was never originally designed for modern analytics or AI.
Why Industrial Data Analytics Finland Matters for Manufacturers
Finland has a strong technology and manufacturing base.
The technology industry is responsible for approximately 65% of business R&D investment in Finland, with companies investing around €6 billion annually. Mechanical engineering and metal products generated approximately €38.3 billion in revenue in 2025. These figures are also supported by Technology Industries of Finland. Teknologiateollisuus ry
At the same time, industrial systems can remain operational for decades.
That creates an unusual situation.
A factory may have sophisticated instrumentation, sensors, control systems, and years of machine history—but an analytical layer that was never designed for today’s AI and data requirements.
This is where industrial data analytics Finland becomes less about buying new technology and more about extracting value from existing infrastructure.
5 Ways Industrial Data Analytics Can Create Value
1. Unlocking Machine Data
Connected industrial equipment can generate huge volumes of information.
But raw machine data is rarely business-ready.
A dataset may contain technical tags such as:
321FN125M01I01
To an analyst, this identifier may mean almost nothing.
To the original control system, however, it may correspond to a specific instrument, measurement, alarm, or piece of equipment.
The first analytical task is therefore often data resolution.
Instead of immediately building a new AI model, start by understanding the vocabulary already contained within the system.
Many industrial control systems carry their own configuration information, including point tables, alarm descriptions, and report definitions.
In other words, the system may already contain the dictionary required to understand its own machine data.
2. Establishing What “Normal” Looks Like
An isolated number rarely tells you whether something is wrong.
You need a baseline.
For example, a temperature of 80°C could be completely normal for one machine and a serious anomaly for another.
Industrial data analytics can establish normal operating ranges by examining historical behaviour.
But there is an important rule:
Do not allow the event you are investigating to contaminate the baseline.
If a baseline includes a period when the machine was already failing, the analysis may underestimate the difference between normal and abnormal behaviour.
A reliable baseline should represent genuine normal operating conditions.
Once that baseline exists, manufacturers can begin identifying unusual behaviour much more reliably.
3. Separating Volume From Breadth
This is one of the simplest—and most useful—industrial analytics concepts.
Imagine a plant reports:
1,000 alarm events.
That sounds serious.
But what if 950 of them came from one malfunctioning sensor?
The event volume is high.
The operational breadth of the problem may not be.
Now imagine another plant records 1,000 events originating from 200 different instruments.
That tells a very different story.
The important question is therefore not only:
“How many events occurred?”
It is also:
“How many independent sources generated them?”
Comparing event volume with the number of distinct sources can reveal whether a problem is concentrated around one component or distributed across the wider operation.
4. Finding Data That Existing Reports Ignore
Industrial systems often collect far more information than management reports display.
This creates a common data-utilisation problem.
Research commissioned by Seagate and conducted by IDC found that only 32% of enterprise data was being put to work, leaving 68% unleveraged. seagate.com
In industrial environments, the problem can be especially persistent because systems are usually built first to operate equipment safely and reliably—not necessarily to support analytics projects years later.
A management report may show ten metrics while the underlying control system contains hundreds.
The opportunity is often hidden beneath the reporting layer.
Industrial machine data analytics can help companies identify those unused signals and determine whether they contain operational value.
5. Creating a Better Foundation for Industrial AI
AI needs usable data.
That sounds obvious, but it is one of the most overlooked parts of industrial AI.
Before asking:
“Can we build predictive maintenance?”
ask:
“Do we have enough reliable historical data to support prediction?”
Prediction requires historical examples of failures and the operating conditions leading up to them.
If a company does not have structured maintenance records or enough historical failure events, predictive maintenance may not yet be realistic.
In that situation, anomaly detection against a reliable baseline may be a more appropriate first step.
That distinction matters.
Good industrial AI begins with evidence—not promises.
What the EU Data Act Changes
The opportunity is becoming even more relevant across Europe.
The EU Data Act began applying on 12 September 2025, giving users of connected products greater rights to access and use data generated by devices including industrial machinery. digital-strategy.ec.europa.eu
For industrial operators, this creates an important strategic question:
If you can access more machine data, can your organisation actually use it?
Data access is only the first step.
The competitive advantage comes from being able to interpret that data and transform it into operational knowledge.
A Practical Approach to Industrial Data Analytics
At AImpulse, we recommend starting with the evidence rather than the technology.
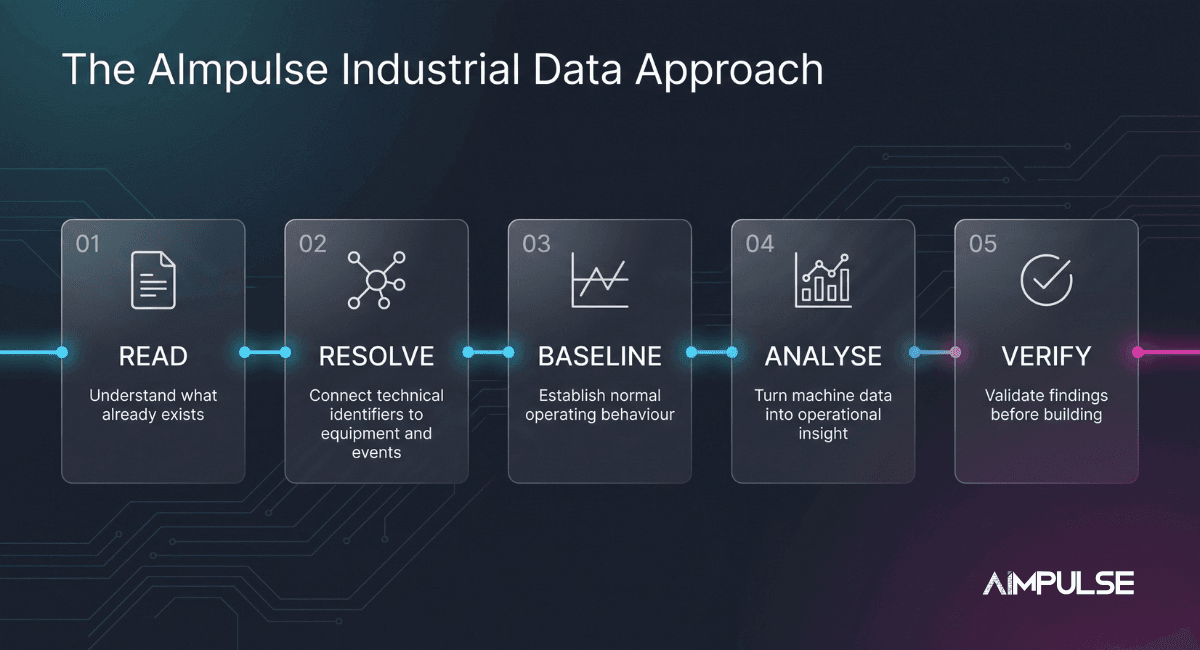
Step 1: Read
Open the actual files and data sources.
Do not begin with a target architecture.
Understand what already exists.
Step 2: Resolve
Connect technical identifiers to equipment, measurements, alarms, and events.
Turn machine codes into information people can understand.
Step 3: Baseline
Establish normal operating behaviour using reliable historical data.
Make sure abnormal periods do not distort the baseline.
Step 4: Analyse
Analyse the relationships inside the data.
Separate event volume from the breadth of affected equipment, identify recurring patterns, and determine where unusual behaviour is concentrated.
Step 5: Verify
Recalculate important findings and make corrections visible.
Validation should happen before major technology decisions are made.
This approach helps prevent an expensive problem:
building sophisticated technology around assumptions that the data does not support.
What Industrial Data Cannot Tell You
This is equally important.
Industrial data analytics cannot magically create historical information that was never recorded.
If a plant has no meaningful maintenance history, reliable failure prediction may not be possible yet.
That does not mean the project has failed.
It means the correct objective may be:
anomaly detection today + a roadmap toward predictive capability tomorrow.
Knowing the difference protects both the engineering team and the investment.
The AImpulse Industrial Data Approach
Our approach is simple:
Read → Resolve → Baseline → Analyse → Verify
We use the data itself to determine what can responsibly be built.
That may lead to:
- Industrial analytics
- Anomaly detection
- Data-quality improvement
- Operational dashboards
- AI readiness assessments
- Predictive maintenance foundations
- Custom industrial AI systems
The architecture comes after the evidence.
Not before it.
Frequently Asked Questions
What is industrial data analytics?
Industrial data analytics is the process of analysing data generated by machines, sensors, control systems, and production processes to improve operational decision-making.
Why is industrial data important for Finnish manufacturers?
Industrial data can reveal equipment behaviour, production patterns, maintenance signals, and operational inefficiencies without requiring a completely new technology stack.
Can old industrial systems be used for AI?
Sometimes. The first step is determining whether the existing data is accessible, understandable, complete, and historically sufficient for the intended AI use case.
Is predictive maintenance always possible?
No. Predictive maintenance requires sufficient historical failure and maintenance data. Where that history is missing, anomaly detection and improved data collection may be more appropriate starting points.
How AImpulse Helps
AImpulse works with organisations that want to move from industrial data to practical intelligence.
We do not begin by selling a model.
We begin by understanding what the data can actually support.
Read first. Build second.
Whether the right outcome is industrial analytics, anomaly detection, AI readiness, or the foundation for predictive maintenance, the first step is understanding the evidence already available.
If you want to understand what your industrial data already contains, talk to AImpulse about an industrial data assessment.
Conclusion
Finland’s industrial opportunity is not only about installing smarter machines.
It is also about learning to read the machines already operating.
Existing industrial data may already contain the signals required to understand equipment behaviour, identify anomalies, improve operations, and prepare for more advanced AI.
The first question is therefore not:
“What AI should we buy?”
It is:
“What does our existing data already know?”
That is where industrial data analytics Finland becomes valuable—and where better industrial AI can begin.